
-1.png?width=475&name=graymail-suppression-email-details%20(1)-1.png)

How can you make sure that both the marketing and the sales department reach their goals and thus...
So it’s time to create your next Inbound Marketing report and you really want to impress your boss. To give your boss something they’d actually care about, don’t just include metrics like blog post views and web traffic. While those metrics are nice to be aware of, there are so many more important things you can and should include instead. Here’s how you can make your next Inbound Marketing report a lot more interesting.

What to Avoid
The crucial thing to remember if you want to take your Inbound Marketing report to the next level is to avoid the vanity metrics. Stop obsessing over the traditional metrics like traffic, retweets and likes on social media, blog post views and how big your email contact database is.
They don’t really mean anything, it’s just showing you that you have an audience or a potential audience. You need to look at the following instead.
Top Level Traffic Metrics
‘Top level’ might sound vague but the traffic metrics that fall under this category are the ones your boss will really care about.
Rather than focusing on things like finding out your top five most-viewed blogs which every Inbound Marketing report will feature, analyse which pages have completed the most goals or conversions instead. It’s important to know how and why so many users came rather than just how many.
Focus on your CTAs and find out how many people have actually clicked on them - as that’s the intent of those CTAs. You should even shift your focus to how many people have left their phone numbers by analysing the call tracking feature. Here, you can see how many calls are made from each page, which pages have generated the most calls and summarise those instead.
That’s just one way of taking those important reports to the next level, compared to just jotting down the top five traffic pages which don’t really show anything or give any opportunities to learn from.
The main message from the top level traffic metrics you analyse is that you can capitalise by knowing there’s something there that’s working. When you know there’s something there, you can implement that on other pages to improve conversion.
Lead Generation
Lead generation is different from contacts generated, which is basically when users submit a form. That’s still good to know, though, as it shows your CRM - like HubSpot - is working and you’re generating a database.
The number of contacts you generate over a certain time period is something you’d stick in your ordinary Inbound Marketing report. To make it more interesting, you, your team and your boss will want to know what a lead actually is and what defines it.
The best metric to include in your report is to break your leads down to marketing qualified leads (MQLs) and sales qualified leads (SQLs). An MQL is where your marketing team has qualified the particular lead as a good fit. It can be that the lead is a marketing manager, they live in the UK, they’ve given you their company name or email address - it’s as simple as that. So, they’re worthy and you market to them.
On the other side, we have SQLs. This is the criteria set by your sales team. The lead might have read your pricing page, they might have visited it more than five times, they might have opened 10 emails, they might have downloaded your pricing guide or pretty much any other buyer-led action. That’s what makes them an SQL.
Once you have defined those and use a CRM like HubSpot to know when that’s happened so you’re notified, that’s something you should be reporting on. So the main message to take into account that it doesn’t matter how many contacts you’ve generated, including that in your reports won’t show any real value. It matters more on how many SQLs and MQLs you’ve generated.
For example, your business might agree on a KPI that you need 20% of your leads to become SQLs. If you manage to get 20 per month, then that’s the definition of a success. If you didn’t manage to reach that goal, then the definition of your MQL might not be right. The definition will probably need tweaking so you can achieve your targets easier and whittle down those MQLs to make into SQLs as they need to close.
So make sure you stay on top of this to see how many MQLs and SQLs have been generated, as this is likely to be something you won’t find in regular Inbound Marketing reports.
Social Media Metrics
Retweets, likes and shares are great on social media, everyone loves them. However, they aren’t really the types of metrics that should be going into a report as they’re not that interesting. Anybody can find them.
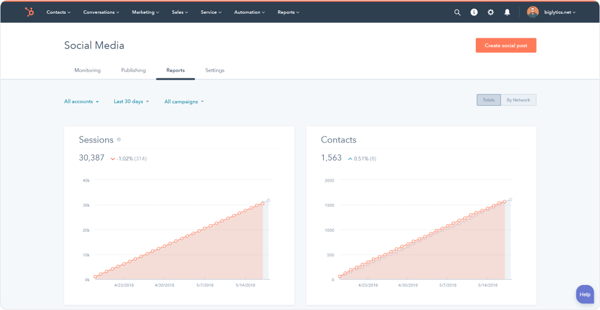
Instead, focus on metrics like sessions generated from social, visits to your website as well as post reach. For example, if your post reach is up and sessions are looking flat, then you’re clearly targeting the wrong hashtags or audience. If your post reach is the same and your sessions are increasing, then you’re getting a higher click-through rate (CTR) and more engagement.
Report on that instead as post reach is showing why the users are checking out your content.
When you’re reporting on sessions from social, treat it like SEO as you want that traffic. However, it’s more direct than organic as they’re already half-qualified compared to those leads that are typing in keywords into a search engine.
It’s also beneficial to compare if your content is being downloaded organically or through your social account. People might be searching for specific terms and coming across your content, whereas on social they might come across your content because of an engaging image, for example.
So forget those likes and retweets in your reports, and focus on the three metrics above.
Email Metrics
The final metrics you should consider including in your Inbound Marketing report to make it much more interesting is focusing on the email aspect. For example, test different subject lines to see which ones worked and which didn’t.
The primary metric you’ll want to focus on is open rates. That’s vital as the open rate per month should be consistent. You’ll want to look at and report on CTR mainly - how many click through to your website, how many click on your guides or products and so on.
Also, make sure you track unsubscriber rates as well as churn rates. The latter is essentially the percentage of emails that ‘bounced’ (when the emails can’t be delivered), marked your emails are spam or are just dead emails so they didn’t end up landing in an inbox. By tracking these metrics and including them in your report, you’re also able to use that data to clean up your contact database to only keep the most engaged contacts.
A Bonus Tip...
When you're creating your next Inbound Marketing report; consider creating graymail lists. It’s quite an important metric that most marketers miss and you’ll need a tool like HubSpot to get started.
Graymail is all of the emails that your contacts opted-in to receive - but they don’t really want them. This helps to keep your contact database clean so that it’s always full of meaningful contacts. For more information about graymail lists as well as how to improve your email marketing strategy, check out this blog.
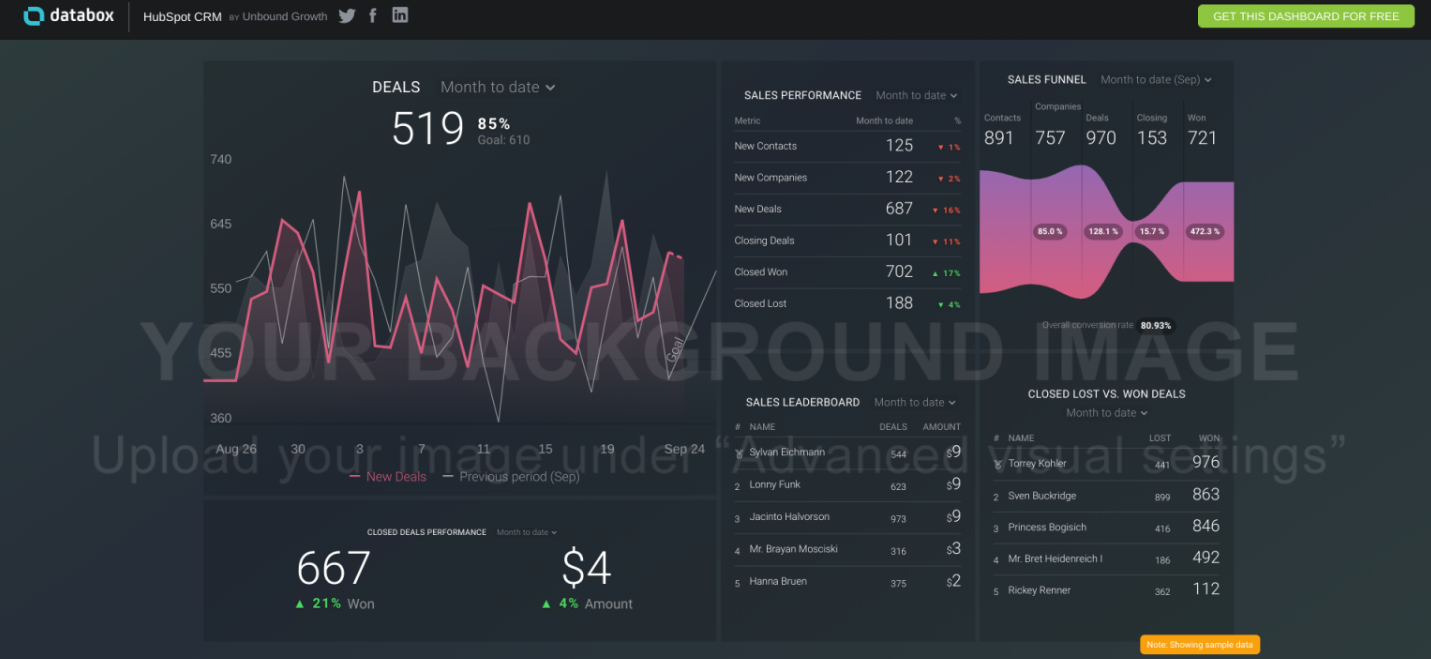
...Another Bonus Tip: Use a Tool Like Databox
A tool we use regularly and find it incredibly useful for reporting to our clients is Databox. Databox is a business analytics KPI dashboard and gather all of the metrics that actually matter in one place to help deliver the crucial KPIs.
The reasons Databox is a vital tool to incorporate are:
- You're able to dip into your figures whenever you like.
- The data is presented on an easy-to-interpret series of dashboard on a bookmarkable URL.
- You're able to quickly screengrab the dashboard at any time. This means you no longer have to wait around for monthly calls.
By combining all of the above, you’ll successfully take your Inbound Marketing report game up a notch. By eliminating the traditional metrics that marketers wrongly obsess over and including metrics you, your team and your boss will actually care about, you’ll set your business up for more successful growth.
Get More Information on All Things Inbound Marketing
Inbound Marketing reports don’t need to be boring and full of metrics that don’t show any real value. However, these reports are just one of the many aspects that can help boost your Inbound Marketing efforts. Rather than piling all of that information here, we’ve made life easier by creating an easy-to-read guide which you can check out on-the-go.
To grab your free copy and learn some useful tips, tricks and methods to how you approach Inbound Marketing moving forward, click on the link below to grab your free copy.